
| Instruction |
 |
|
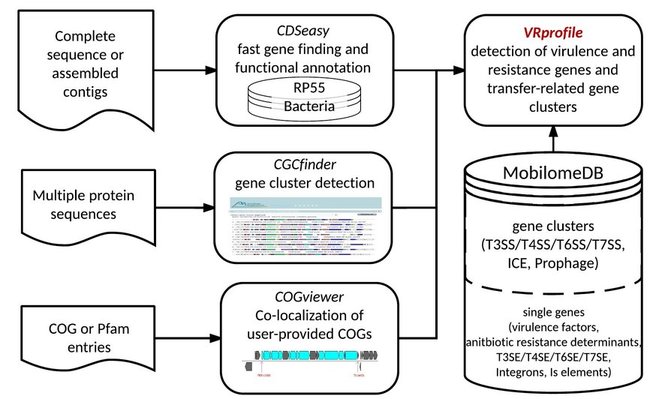
Some bacterial accessory genes coding for virulence factors and antibiotic resistance determinants, such as siderophores and antibiotic-inactivating enzymes may exist as solitary genes. However, most accessory genes carried by mobile genetic elements (MGE) are often organized as functional clusters that code for or constitute entities such as fimbrial appendages, prophages, pathogenicity islands, resistance islands and Type III/IV/VI secretion systems. In this study, the VRprofile web server had been designed to quickly identify and localize virulence or antibiotic resistance genes and extended MGE-related gene clusters as well, in newly sequenced bacterial genomes.
|
|
|
| VRprofile
is designed to identify and localize virulence or antibiotic resistance genes and extended mobilome-related gene clusters as well, in newly sequenced bacterial genomes. VRprofile is assisted by CDSeasy to quickly annotate newly sequenced chromosomes, by CGCfinder to detect gene clusters, by COGviewer to localize and cluster user-provided COGs, and by the MobilomeDB database that collected and organized the known data about virulence factors and antibiotic resistance determinants on the single gene and gene cluster scale. VRprofile combines the homology search approach with the sequence composition approach to predict virulence- and antibiotic resistance-related gene clusters and genomic island-like regions in a query genome sequence of a pathogenic bacterium. These island-like regions are often involved into the horizontal transfers of the virulence factor genes and the antibiotic resistance determinant genes. With the integration of the homologous gene cluster searches module with a sequence composition module, VRprofile exhibited a good performance for island-like region predictions. In addition, it also provides an integrated interface for alignment and visualization of the identified gene clusters with MobilomeDB-archived gene clusters, or a variety set of bacterial genomes. The online tool VRprofile then performs rapid homology searches of a query genome sequence against MobilomeDB based on both protein sequence similarity and gene order. A sequence composition method is also integrated by VRprofile as a complement of island detection. VRprofile outputs a simple list and also generates a graphic overview of not just single virulence or antibiotic resistance genes, but of extended transfer-related functional gene clusters. This server might facilitate the rapid detection of various virulence- and antibiotic resistance-related gene clusters in dynamic genomic regions of bacterial pathogens. How to use VRprofile: Step 1: Upload your GenBank-formatted file or FASTA DNA sequence file, or input FASTA DNA Seqquence file as well as protein coding gene annotation file (NCBI PTT formatted). Step 2: Select options of interest from single gene or gene cluster scale as subject dataset. Step 3: Select Result retrieval option: Wait on line or Send E-mail notification is applicable. Step 4: Press the "Run" button. The following page will be shown. Once the file upload has been completed, the following processing status page will be shown. The final result will appear in 15-20 minutes. Summary File, Detailed List as well as Images with Circular and Linear format are available, and a linear map as an example from Escherichia coli O157:H7 EDL933 is listed as follows: |
| 1.1 in silico profiling of virulence and antibiotic resistance traits encoded within genome sequences of pathogenic bacteria |
 |
|
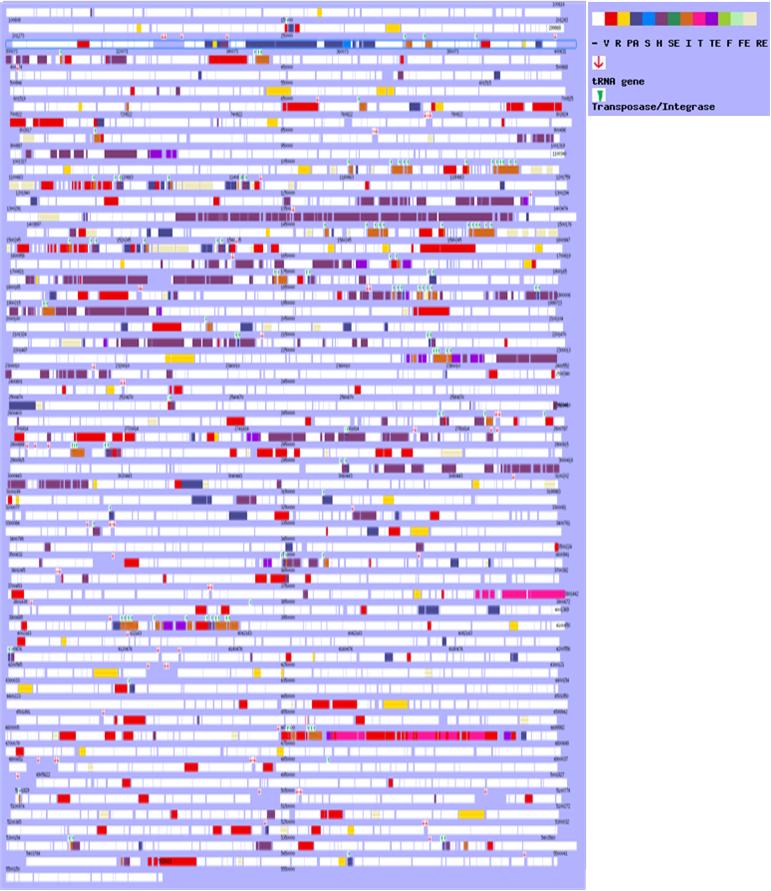
Figure 1. Genome map of reference genome with gene colour-coded based on the number of query datasets identified.
Line Length: 100 kb. Note: (V) viruelence factor, red; (A) antibiotic resistance determinant, yellow; (PA) pathogenicity island, cyan; (T) type III secretion system, deeppink; (F) type IV secretion system, olivedrab; (S) type VI secretion system, blue; (H) prophage, purple; (TE) type III secretion effector, darkviolet; (FE) type IV secretion effector, seagreen; (SE) type VI secretion effector, green; (I) IS element, chocolate; (RE) resistance island, LemonChiffon2; (ICE) integrative and conjugative element, lawngreen; (Int) class I integron, black. |
| 1.2 Investigate genomic mosaicism and examine variable regions encoding T6SS in Escherichia coli O157:H7 EDL933 |
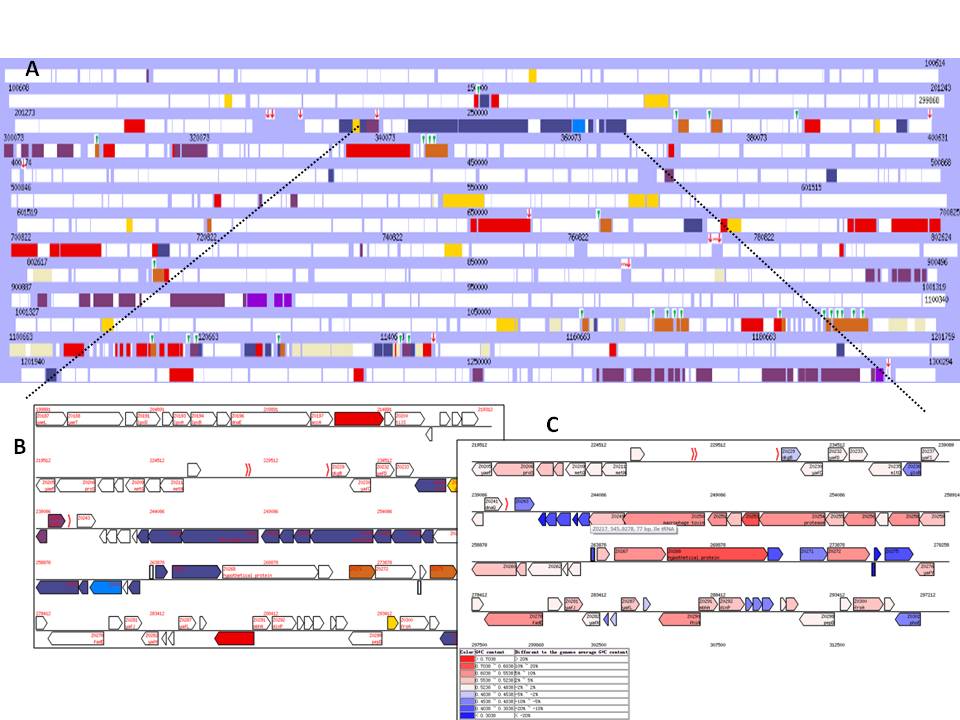 |
Figure 2. Screenshots for VRprofile: Genome map of Escherichia
coli O157:H7 EDL933 (RefSeq accession NC_002655 as input). A candidate T6SS gene cluster with upstream tRNA and downstream IS-associated genes were screened and represented in blue via the flexible filtration criteria (Figure 2A), possessing high similarity with RS218-derived genomic island 1 (RDI-1) characterized in Escherichia coli K1 RS218 [Zhou Y et al., 2012]. The CDS information (Figure 2B, located on a genomic island previously identified in E. coli EDL933 by MobilomeFINDER) and G+C% profile (Figure 2C, G+C content differing from the average as shown) were provided to the subscribers. The zoom-out view and accessible analytic tools option are also available. Hyperlinks to NCBI are provided as appropriate, as is a cross-link that allows for visualization facilitated by the embedded graphic display of the matching gene cluster. NOTE: This T6SS gene cluster could be identified in the genome (NCBI Accession: NC_002655) of Escherichia coli O157:H7 EDL933 via COGviewer with 13 relevant COG entries. |
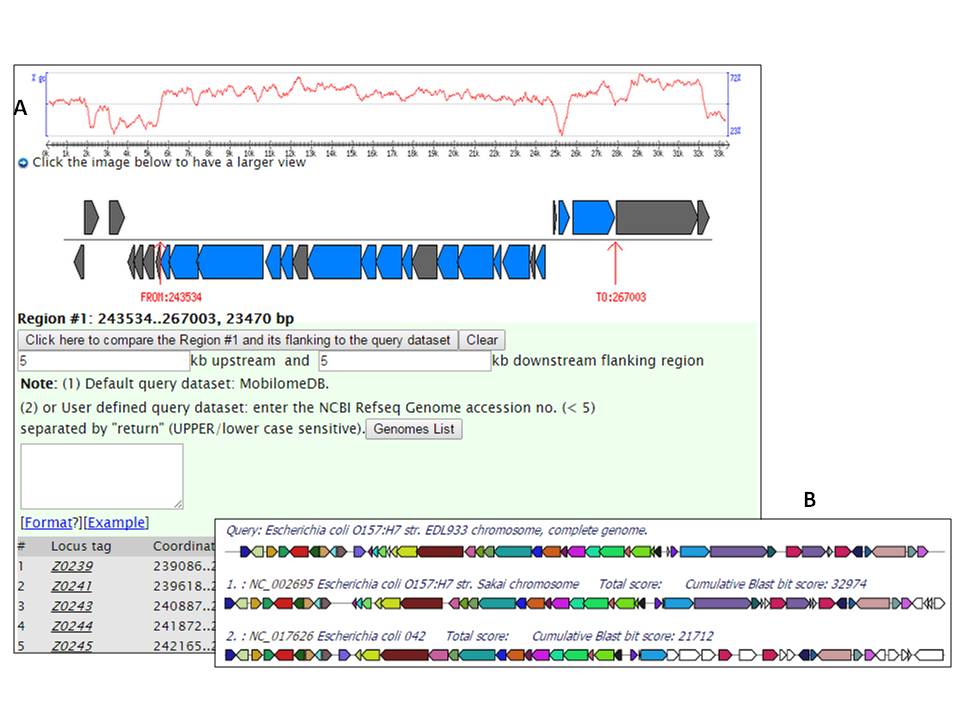 |
Figure 3. Integrated gene cluster alignment: the T6SS (Figure 3A) in Escherichia
coli O157:H7 EDL933; Comparative map (Figure 3B) of the T6SS gene clusters with CDS color-coded based on the hits of comparator
E. coli genomes identified as harboring a sequence-conserved
homologue; CDS shown in the matching colour are conserved across the two other full-sequenced
E. coli genomes, E. coli O157:H7 Sakai
(NC_002695) and 042 (NC_017626); while at the other extreme those
shown in white maybe unique to O157:H7 EDL933.
|
|
|
| The online tool “CGCfinder” is able to implement the BLASTP and TBLASTN-based comparative investigation of the bacterial genomic contexts at different scales, including the gene cluster (~10 Kb in size) and the genomic island (~30-250 Kb in size). It gives efficient retrieval visualization for the identified gene clusters by using MultiGeneBlast [Medema et al. Mol Biol Evol, 2013].For convenience, users could submit sequenced genome or scaffolds/contigs to generate custom databases. Furthermore, syntenic conservation (providing the annotated file with the genomic region of interest as input) and gene re-organization architecture (given the multiple protein fasta file) models have been integrated. |
| 2.1 Input [TOP] |
|
STEP 1: (1) You will be asked to input the focused locus of interest. (2) You can either upload your protein sequences in Multi-FASTA format.  STEP 2: (1) Choose your subject genome(s) by accession number or select from "Genome List". (2) Accession numbers should be separated by "return". (3) After selecting subject genome(s), click 'Submit' to submit accession number(s). You can click "[TOP]" and back to "Submit" easily.  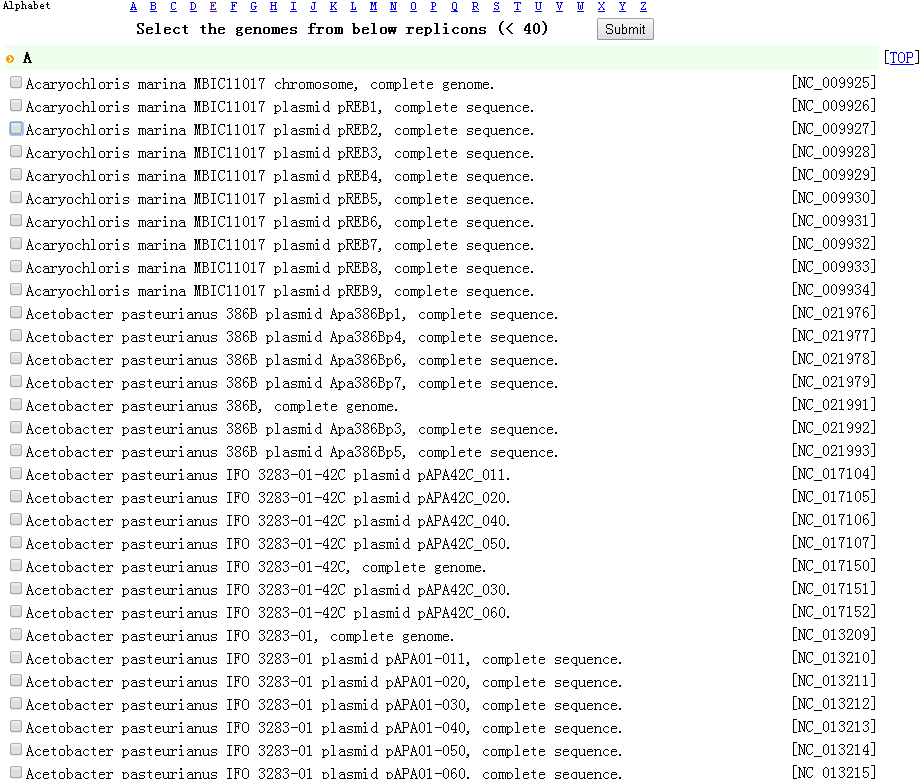 STEP 3: Set parameters and click "Run".  |
| 2.2 Compare [TOP] |
| Example: The selected annotated gene cluster carrying a Type VI secretion system (T6SS)has been previously identified in Escherichia coli O157:H7 EDL933 genome (Figure 1). Alignment against the completely sequenced genomes of E. coli 042 and O157:H7 Sakai is applied. |
| To examine the degree of sequence similarities at an amino acid level between each query protein and the MobilomeDB-collected virulence factors (VF) and acquired antibiotic resistance determinants (AR), VRprofile employs the NCBI BLASTp-derived Ha-value, similarly to the BLASTn-based H-value (Fukiya et al., 2004). For each query, the Ha-value was calculated as follows: |
| For each annotated CDS, a
threshold value of Ha ( |
 |
Figure 4. Comparative map of Escherichia
coli O157:H7 EDL933 (NC_002655 and from 236148 to 277370 as input) with CDS color-coded based on the hits of comparator
E. coli genomes identified as harboring a sequence-conserved
homologue; CDS shown in the matching colour are conserved across the two other full-sequenced
E. coli genomes, E. coli O157:H7 Sakai
(NC_002695) and 042 (NC_017626); while at the other extreme those
shown in white maybe unique to O157:H7 EDL933. E. coli O157:H7 EDL933 specific CDS were identified with an Ha-value
cutoff less than 0.42. The Ha-value reflects the degree of similarity
in terms of the length of match and the degree of identity between the matching query genome sequence and the CDS examined. |
 |
Figure 5. Gene re-organization: one T6SS map of Escherichia
coli 042 (multiple protein fasta sequences as input using CGCfinder) with CDS color-coded based on the hits of comparator
genomes identified as harbouring a sequence-conserved
homologue; CDS shown in the matching colour are conserved across selected full-sequenced
Salmonella enterica, Vibrio cholerae, Pseudomonas aeruginosa and Escherichia coli genomes. |
| [TOP] |
|
|
|
The online tool "COGviewer" can perform RPS-BLAST or profile-HMM searches to detect co-location features for the user-supplied COG (Clusters of Orthologous Groups of Genes) or Pfam (Sanger protein families) entries. It is designed to quickly explore low similarity, compositionally distinct gene clusters that encode the conserved protein domains under investigation. COGviewer outputs include a list of all identified co-localized genes encoding COG-homologues to the diverse combinations of COG entries. It is easy to do manual curation of the homologues present in genomic context. |
|
|
| The online tool "CDSeasy" can finish gene-finding and initial functional annotation for an assembled bacterial genome sequence in tens of minutes. |
|
Easy to prepare the assembled contig/scaffold sequences from your partially sequenced bacterial genomes: Step 1. Prepare a plain file containing the assembled contig/scaffold nucleotide sequences in the Multi-FASTA format, like mysequence.fas (3.9 Mb). Step 2. Use CDSeasy to annotate your sequences. Upload your file, myseq.fas, into CDSeasy to generate a GenBank file, like, mysequence_ It takes ~18 minutes for CDSeasy to annotate the 5.3-Mb chromosomal sequence of K. pneumoniae strain HS11286. Step 3. Upload your sequences as the reference sequence of VRprofile, CGCfinder and COGviewer. Select the 'Upload sequence' and then click the radio " or Upload a GenBank file containing the nucleotide sequence and annotation"; Upload the file CDSeasy-output file, mysequence_ For partially sequenced bacterial genomes, CDSeasy firstly generates a 'virtual complete genome' ('pseudochromosome') by connecting contig sequence without considering contig order and provides both contig-specific gene coordinates and corresponding pseudochromosome data. Reorder of Contigs/Scaffolds using MUMmer3 alignment against a completely sequenced reference bacterial genome is also optional. CDSeasy outputs include the sequence and annotation files in commonly used formats, such as GenBank. The CDSeasy-generated GenBank file can be used directly as the input for other STeP tools, including CGCfinder, COGviewer and VRprofile, for further analysis. |
| [TOP] |
| 5.1 A single genome sequence file: FASTA |
| A single
genome sequence file is prepared in FASTA format. It begins with a single-line
description, followed by lines of sequence data. The description line
must begin with a ">" symbol in the first
column. It is recommended that all lines of text be shorter than 80 characters
in length. It is suggested that the user download the *.fna or other required
genome files in FASTA format from the NCBI at ftp.ncbi.nih.gov/genome/bacteria
or specified genome sequencing centres. {wiki} [Example] The genome sequence file of Escherichia coli O157:H7 EDL933 : NC_002655.fna 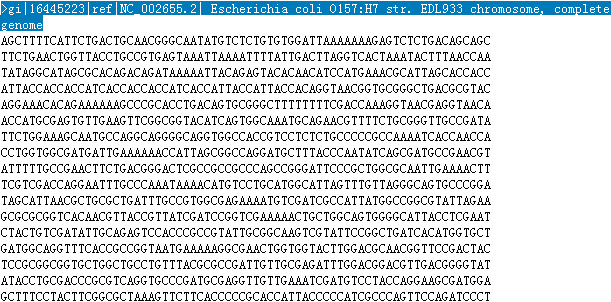 |
| [TOP] |
| 5.2 CDS annotation file: NCBI .ptt format |
| Tabular list of all protein-coding regions (CDS) in the corresponding genome sequence should be prepared in the NCBI PTT format. |
| The PTT file format is a tabular document of genomic protein features which are found in ftp://ftp.ncbi.nih.gov/genomes/. It has the following
infomation: Line 1 Description of sequence to which the features belong eg. "Escherichia coli O157:H7 EDL933, complete genome" It is usually equivalent to the DEFINITION line of a GenBank file, with the length of the sequence appended. Line 2 Number of feature lines in the table eg. " 5312 proteins" Line 3 (*required) Column headers, tab separated eg. "Location Strand Length PID Gene Synonym Code COG Product" [Example] the CDS annotation file of Escherichia coli O157:H7 EDL933 : NC_002655.ptt 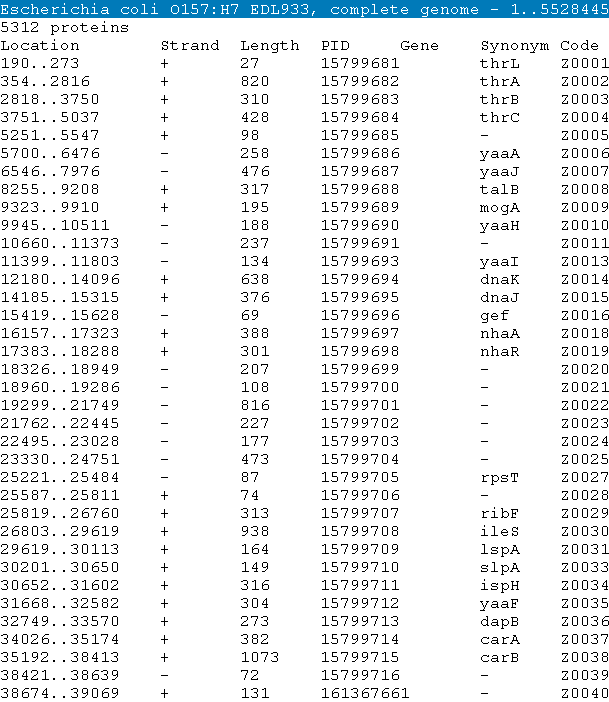 |
| [TOP] |
| 5.3 NCBI GenBank format (.gbk) |
The GenBank format consists of alternating
description lines followed by sequence data. The header of the file contains information describing the sequence, such as its type, shape, length, and source. Features of the genome sequence follow the header, and include protein translations. The DNA sequence is the last element of the file, which ends with (and must include) a double slash.
[Example] the GenBank file of Escherichia coli O157:H7 EDL933 :NC_002655.gbk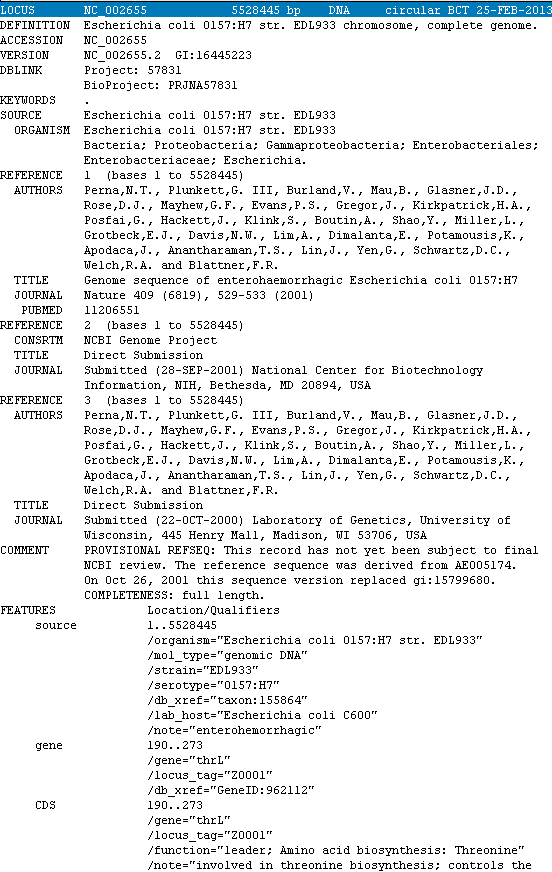 |
| [TOP] |
|
|
|
|
Step 1. Open the link ’http://tool-mml.sjtu.edu.cn/STEP/STEP_VR_preview.html’ or click the ‘Pre-analyzed Genomes’ button in the top of VRprofile submission webpage (http://tool-mml.sjtu.edu.cn/STEP/STEP_VR.html). You will see the following webpage. 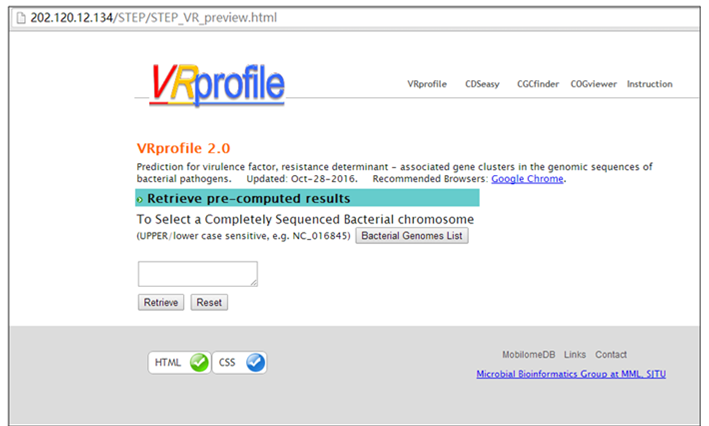 Step 2. Click the ‘Bacterial Genomes List’ button to open a new web page to select one bacterial genome sequence under study, for example, Klebsiella pneumoniae subsp. pneumoniae HS11286 chromosome (NCBI Refseq accession no. NC_016845). Then you could click the ‘Submit’ button in the upper part of the webpage to get the results. 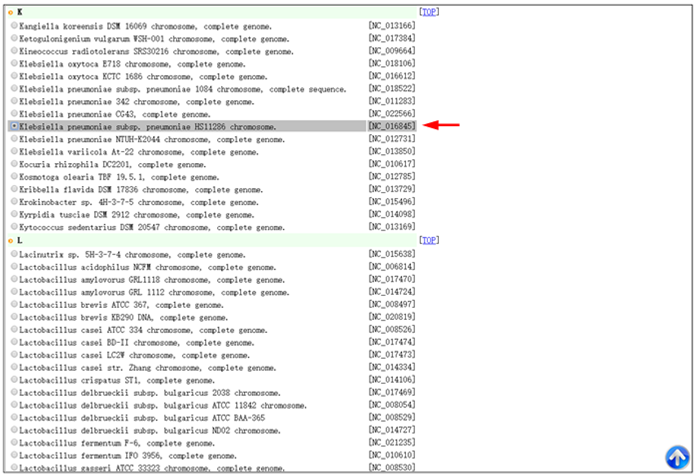 Step 3. The corresponding NCBI accession no. would appear in the ‘Pre-computed Genomes’ retrieval webpage. Then, you could click the ‘Retrieve’ button to get pre-analyzed results. 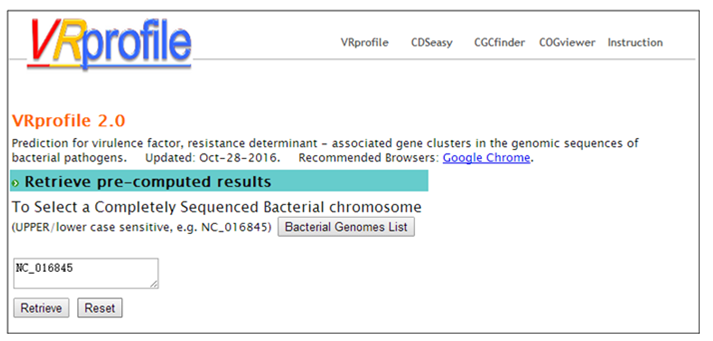 Step 4. Continue to click the ‘Click here to generate the profile’ button to obtain VRprofile pre-analyzed results. 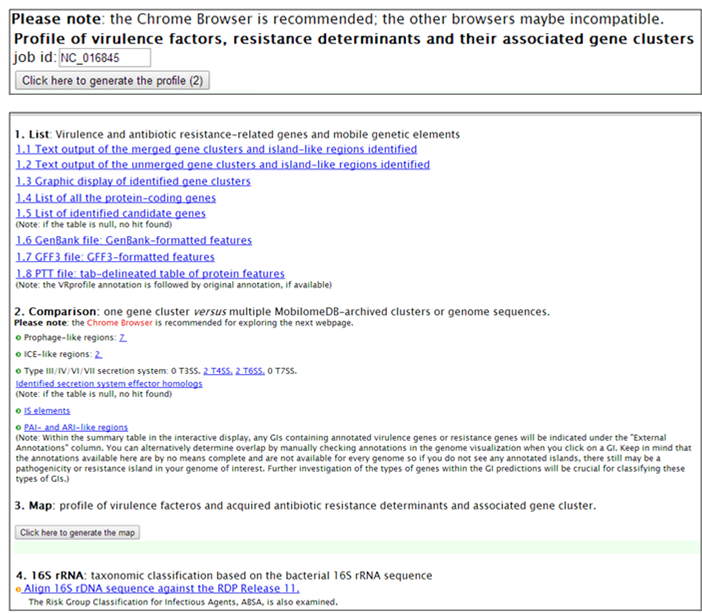 |
|
Step 1. Open the VRprofile link in ‘http://bioinfo-mml.sjtu.edu.cn/VRprofile’ or directly click the VRprofile submission webpage (http://tool-mml.sjtu.edu.cn/STEP/STEP_VR.html). You will see the webpage shown as below 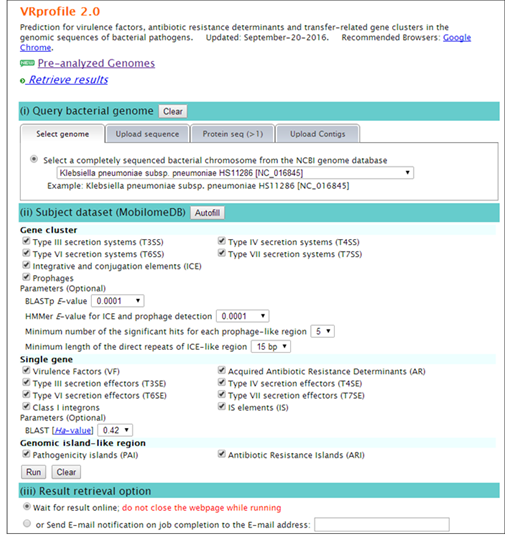 Step 2. Select the ‘upload sequence’ tab, and upload the NCBI GenBank- or FNA/PTT-formatted files as below. Remarkably, virulence- and antibiotic-related determinant searches at gene cluster and single gene scale are flexible. Subscribers could optionally define the parameters in the submission webpage. Lastly, click ‘Run’ button to implement the ‘upload’ and ‘prediction’ progress. 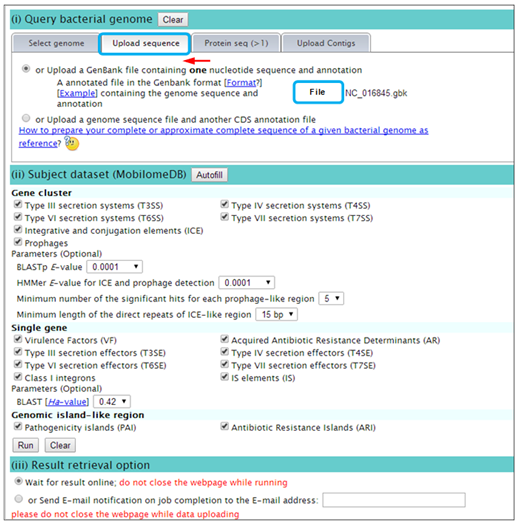 Step 3. After uploading your data completion, you could receive a status webpage that represents the calculation progress. Finally, you could click ‘generate the profile’ button to open the result webpage.  Step 4. Text and graphic results would appear as follows. Hyperlinks are available by clicking the button.  |